Equipment
Method
Null hypothesis; There is no statistically significant difference in the percentage cover of lichen on the north and south facing sides.
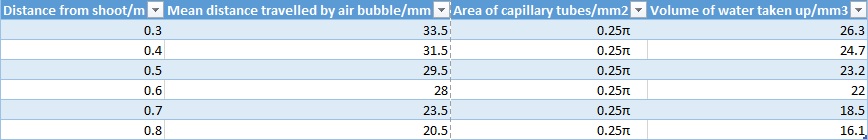
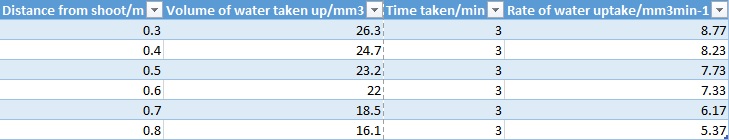
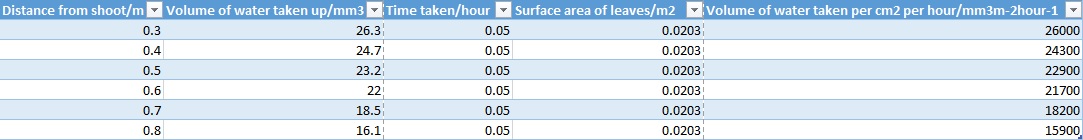
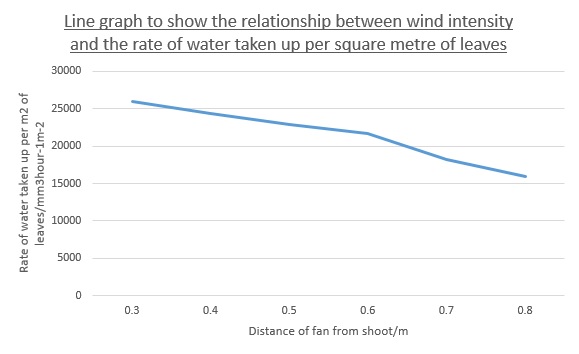
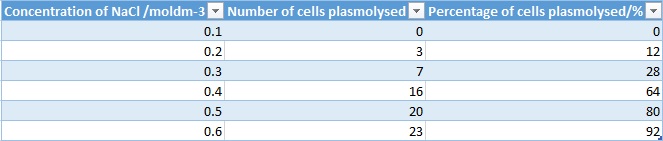
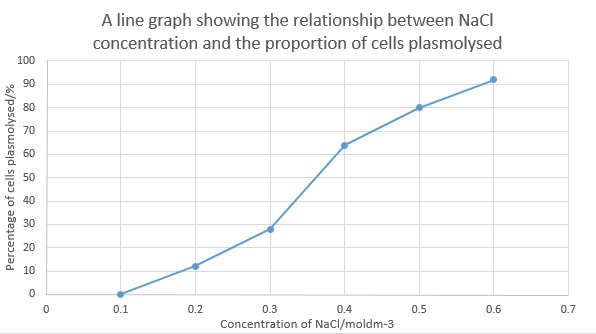
Results
- 0.1mX0.1m flexible quadrat
- 3m piece of string
- Tape measure
- Anemometer
- Light and moisture reader
- 12 trees of same species in same area
- Compass
- Timer
- Thermometer
Method
- Choose a suitable site to take readings at.
- Use a compass to determine which way is north and south and therefore which side of the tree is north facing and south facing.
- Make a suitable results table to record observations, control measurements, and experimental measurements.
- Measure 1m up the tree using a tape measure, measure from the point the tree meets the soil. Use the piece of string to tie round the 1m point on the tree.
- Use the anemometer to determine the wind speed at the south facing and north facing sides, take 1 minute and record the peak wind speed.
- Measure the air temperature at both sides, after holding the thermometer at 1m for 1 minute.
- Measure the light and moisture with the reader holding the end at the point where the string is in contact with the tree at the north and south facing sides.
- Record all the readings in the results table.
- Place the quadrat at the string directly on the south facing side, look at the quadrat for 1 minute and determine the percentage covered by lichen.
- Using a line transect flip the quadrat 180 degrees directly up and repeat reading. Repeat the flip once more, then repeat whole process on the north facing side. Record all results in the table.
- Repeat steps 4-10 on the remaining trees.
- Use a paired t-test to see if the results are statistically significant.
Null hypothesis; There is no statistically significant difference in the percentage cover of lichen on the north and south facing sides.
Results
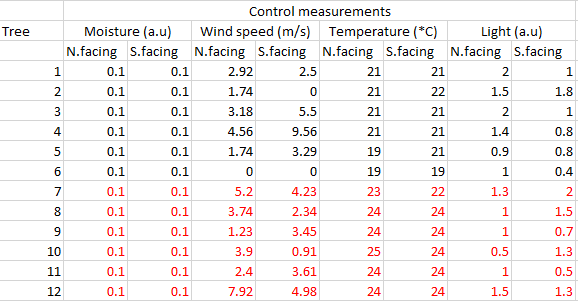
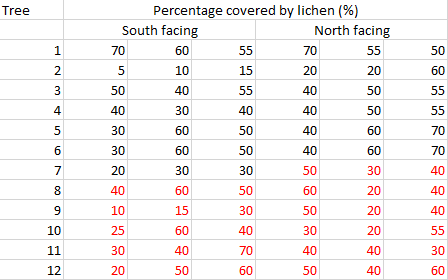
Note; results in red taken at different time to other results
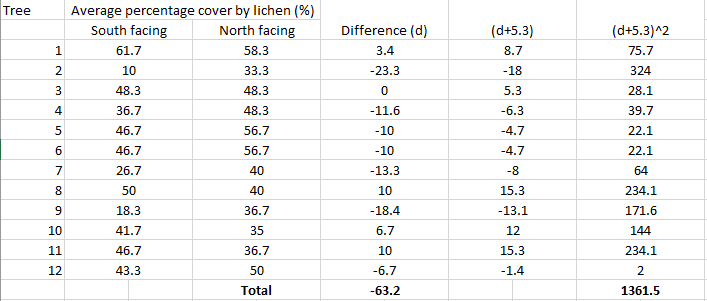
The t test needs to be completed;
Standard deviation=(1361.5/11)^1/2
= 11.1
t=(5.3*(12)^1/2)/11.1
=1.65
Degrees of freedom=11 therefore the critical value is 2.20
1.65<2.20
t<critical value
Therefore the null hypothesis has been proved and there is no statistically significant difference in the percentage cover of lichen on the tree.

 RSS Feed
