Equipment;
- Milk powder suspension
- Trypsin solution (1%)
- 6 test tubes and test tube rack
- Stop watch
- Pippettes (5cm3)
- Safety glasses
- Colorimeter
- 5 cuvettes
- Distilled water
| Method The purpose of the experiment was to see how different concentrations of trypsin affected the time it took for the protein, Casein, found in the milk to break down. The first step was to produce different concentrations of Trypsin; 0.2%,0.4%,0.6%, and 0.8%, in the test tubes, by putting in 2cm3 of trypsin and 8cm3 of distilled water to create a concentration of 0.2%. This was repeated by increasing the volume of trypsin by 2cm3 and reducing the distilled water by 2cm3 to create the 4 concentrations. Once the concentrations had been made up in the test tubes, 2cm3 of milk powder suspension was added to 4 cuvettes. Another cuvette contained 2cm3 of trypsin and 2cm3 of water, to calibrate the colorimeter before each cuvette was placed in. The colorimeter, having been calibrated, the cuvette was removed and a new one with the 2cm3 of milk powder suspension was placed in. Then 2cm3 of 2% trypsin was added and the timer was started. The reading on the colorimeter was recorded every 15 seconds once the experiment had begun. The experiment finished either when the reading on the colorimeter was 100% meaning that all light passed through, there was no change in the reading, or that the reaction had been happening for 5 minutes. This was repeated for all 4 of the concentration of trypsin. | 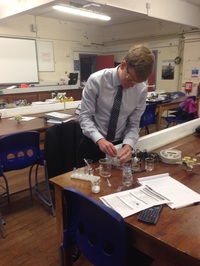 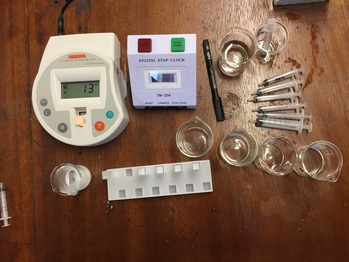 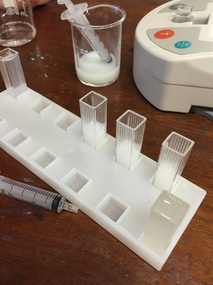 |
Results
Conclusion
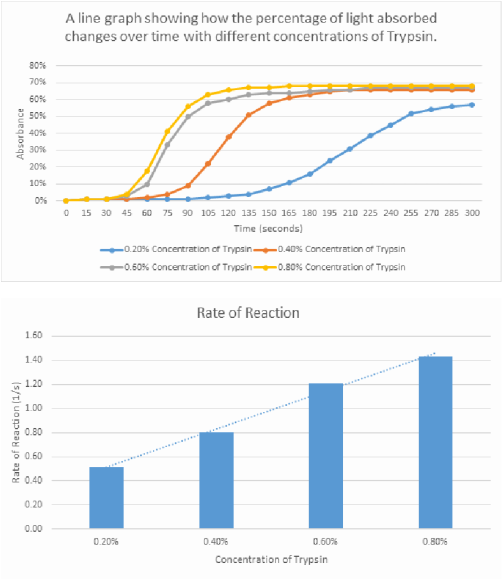
The results clearly show that a greater concentration of trypsin results in a higher initial rate of reaction. This is shown by the initial gradient in the curves in graph 1, the line which represents the results for the concentration of 0.8%, clearly shows that it has the steepest gradient. In graph 2 the rate of reaction is shown in a bar chart, this shows a clear trend in the results, with the lowest concentration of trypsin having the smallest rate of reaction.
The reason behind this is because in a higher concentration there are a greater number of enzymes within the solution. Therefore, there is a lower ratio of substrates to enzymes, this results in more substrates being able to access an active site. Therefore, the milk powder solution will become colourless more quickly as more products are created. This will result in a far higher rate of reaction with the higher concentration of enzyme, due to a far higher frequency of successful collisions.
Questions
Independent Variable- Trypsin concentration
Dependent Variable- Rate of reaction, calculated through the Absorbance/Time
2. As the experiment continues it slows as the total number of substrates decreases. Therefore, calculating the average across the whole experiment will have a negative skew on the results. Hence the values used to calculate the rate of reaction must be the initial values recorded as this is when the reaction is at its distinguishable.
3. It would be a random error, as it is an irregular occurrence in the experiment. A scratch on the cuvette would affect the path of light through the colorimeter causing there to be errors in the reading given. This will affect the precision of the results as the scratch could cause the beam of light to behave in a number of ways.
4.Temperature- the temperature has not been controlled in this experiment. The temperature can affect the results as an increase in temperature would result in a higher rate of reaction due to a higher kinetic energy within the substance, resulting in a higher frequency of collisions and more reactions taking place. The opposite would occur at a lower temperature with the rate of reaction falling.
pH- the pH effects enzyme reactions as enzymes have an optimum pH at which they function at their best. Anything either side of the optimum results in a smaller rate of reaction.
Conclusion
The results clearly show that a greater concentration of trypsin results in a higher initial rate of reaction. This is shown by the initial gradient in the curves in graph 1, the line which represents the results for the concentration of 0.8%, clearly shows that it has the steepest gradient. In graph 2 the rate of reaction is shown in a bar chart, this shows a clear trend in the results, with the lowest concentration of trypsin having the smallest rate of reaction.
The reason behind this is because in a higher concentration there are a greater number of enzymes within the solution. Therefore, there is a lower ratio of substrates to enzymes, this results in more substrates being able to access an active site. Therefore, the milk powder solution will become colourless more quickly as more products are created. This will result in a far higher rate of reaction with the higher concentration of enzyme, due to a far higher frequency of successful collisions.
Questions
Independent Variable- Trypsin concentration
Dependent Variable- Rate of reaction, calculated through the Absorbance/Time
2. As the experiment continues it slows as the total number of substrates decreases. Therefore, calculating the average across the whole experiment will have a negative skew on the results. Hence the values used to calculate the rate of reaction must be the initial values recorded as this is when the reaction is at its distinguishable.
3. It would be a random error, as it is an irregular occurrence in the experiment. A scratch on the cuvette would affect the path of light through the colorimeter causing there to be errors in the reading given. This will affect the precision of the results as the scratch could cause the beam of light to behave in a number of ways.
4.Temperature- the temperature has not been controlled in this experiment. The temperature can affect the results as an increase in temperature would result in a higher rate of reaction due to a higher kinetic energy within the substance, resulting in a higher frequency of collisions and more reactions taking place. The opposite would occur at a lower temperature with the rate of reaction falling.
pH- the pH effects enzyme reactions as enzymes have an optimum pH at which they function at their best. Anything either side of the optimum results in a smaller rate of reaction.
 RSS Feed
